|
By Ioanna Stamataki and Thomas R. Kjeldsen
In the last couple of months, we have continued to work on our 1D hydraulic model of City of Bath as it was predating the current Bath Flood Defence Scheme. As previously mentioned, developing a hydraulic model representing historical conditions is not an easy task and requires different aspects to be carefully considered. The aim of the research was to reconstruct historical floods for which a flood mark existed at Halfpenny Bridge – January 1866, March 1867, July 1875, November 1875, October 1882, November 1888, March 1889, 13th November 1894, 15th November 1894, February 1897, December 1900, February 1900, June 1903, January 1925, March 1947 and December 1960. The reconstruction will ultimately result in a more accurate assessment of the peak flow of the events, which is potentially useful to understand the contemporary flood risk facing the city of Bath.
Having separated the river channel into cross sections from section CS232 in Bathampton down to section CS155 located by Lower Twerton Weir (for more info refer to our previous blog post Hydraulic modelling of Bath's historical floods pre-Bath Flood Defence Scheme: Part I) it became obvious that during all the historical flood events the floodplains around the river were inundated (which was also evident from historical pictures), an effect that was not represented accurately in our model. To further understand the hydraulic balance between the river and the floodplains of the catchment area, we started looking closer at historical pictures from the floods in Bath, mainly from the 1960, 1882 and 1894 floods. Using the Bath in Time online archive numerous photos of Bath during flood events were identified, which initiated the creation of our own interactive historical flood map containing historical photos from Bath in Time overlaid with the Environment Agency’s historic flood map GIS layer showing the maximum extent of individual Recorded Flood Outlines based on records from 1946. At this stage, the objective was not to investigate whether individual street or properties were flooded at the time of the events, but to understand the size of the different floodplains of the city. This allowed us to extend our cross sections to incorporate the effect of the floodplains into the hydraulic model. Figure 1 shows River Avon Cross Section CS200 located about 150 meters downstream from North Parade Bridge. The continuous black line shows the river cross section obtained from an archived engineering drawing and the dashed black line shows the extended floodplains (calculated using the interactive map) towards the Dolomeads.
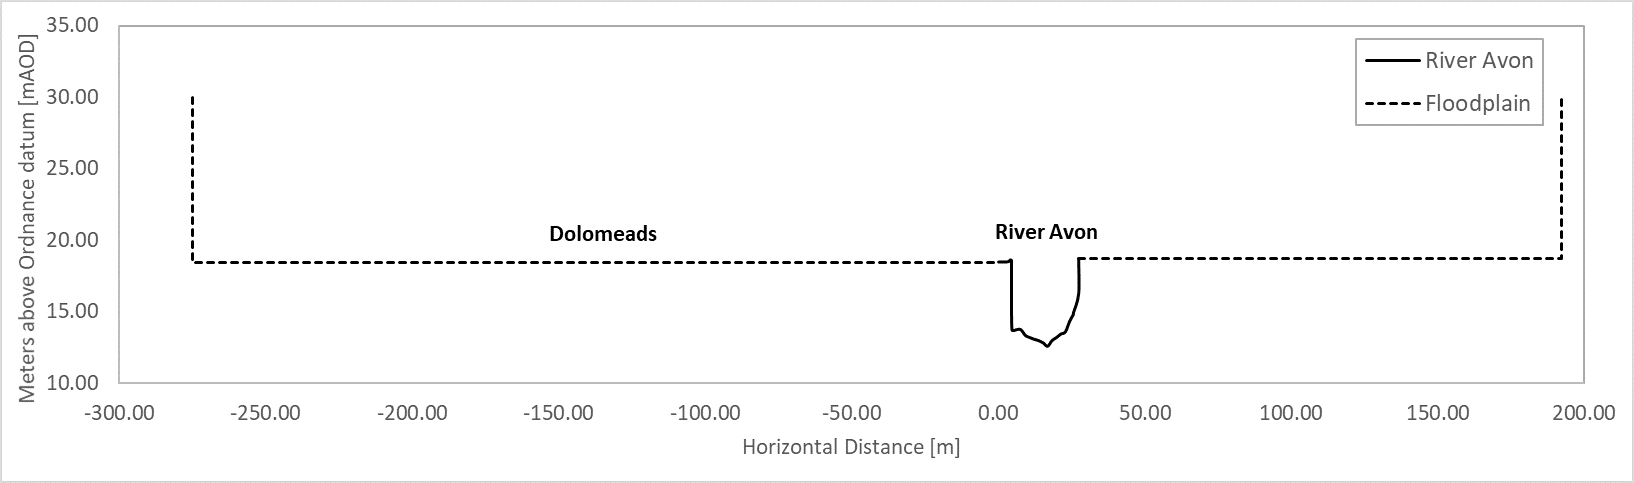
Figure 1. River Avon Cross Section CS200 and extended floodplains towards the Bath Cricket Ground and Dolomeads
The final result of our interactive map is shown in Fig.2 below. The legend on the left is separated in three categories:
Figure 2. Interactive map with historical flood photos and flood extents
We hope you enjoy it, please feel free to navigate it and don’t forget to leave us your comments & thoughts!
Sources
Photos: Bath in Time, 2019 [Online]. Available from: https://www.bathintime.co.uk/ Historic Flood Map: Environment Agency. (2020). Historic Flood Map. Available from: https://data.gov.uk/dataset/76292bec-7d8b-43e8-9c98-02734fd89c81/historic-flood-map
28 Comments
|
