|
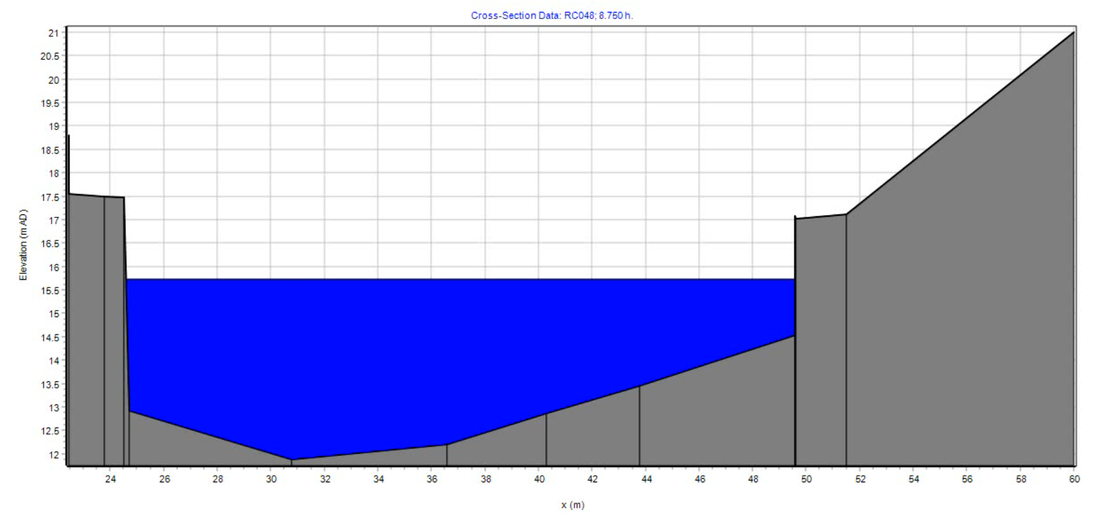
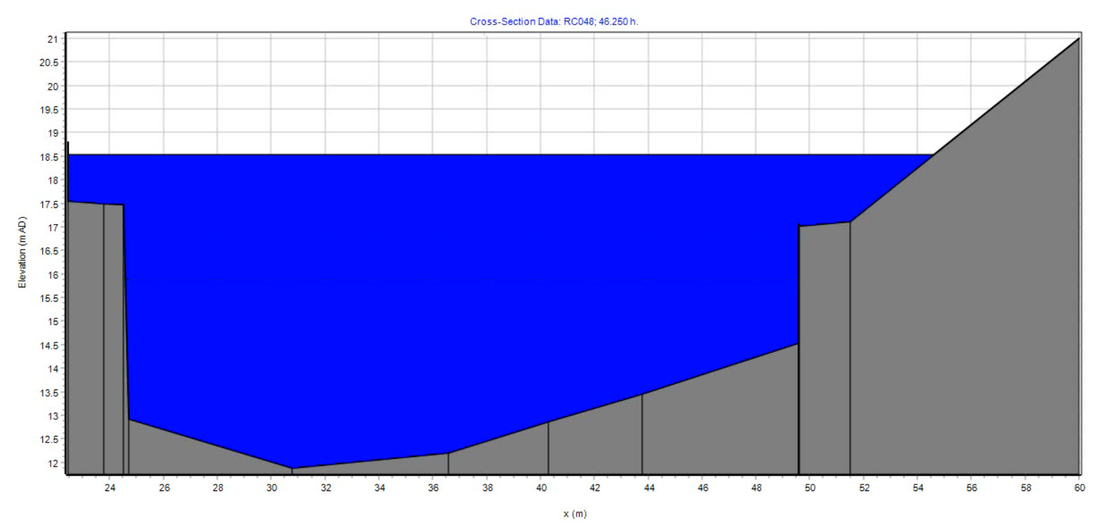
by Ioanna Stamataki and Thomas R. Kjeldsen In the last couple of months, we have been working on a 1D hydraulic model of the stretch of the Bristol Avon flowing through the City of Bath as it was predating the current Bath Flood Defence Scheme. Hydraulic models are a numerical representation of a river and are used as an investigation tool to understand a system’s hydraulic behaviour. They can be useful for flood prediction, planning, catchment management, mitigation strategies, future infrastructure works and in this case for reconstruction of historical flood events. 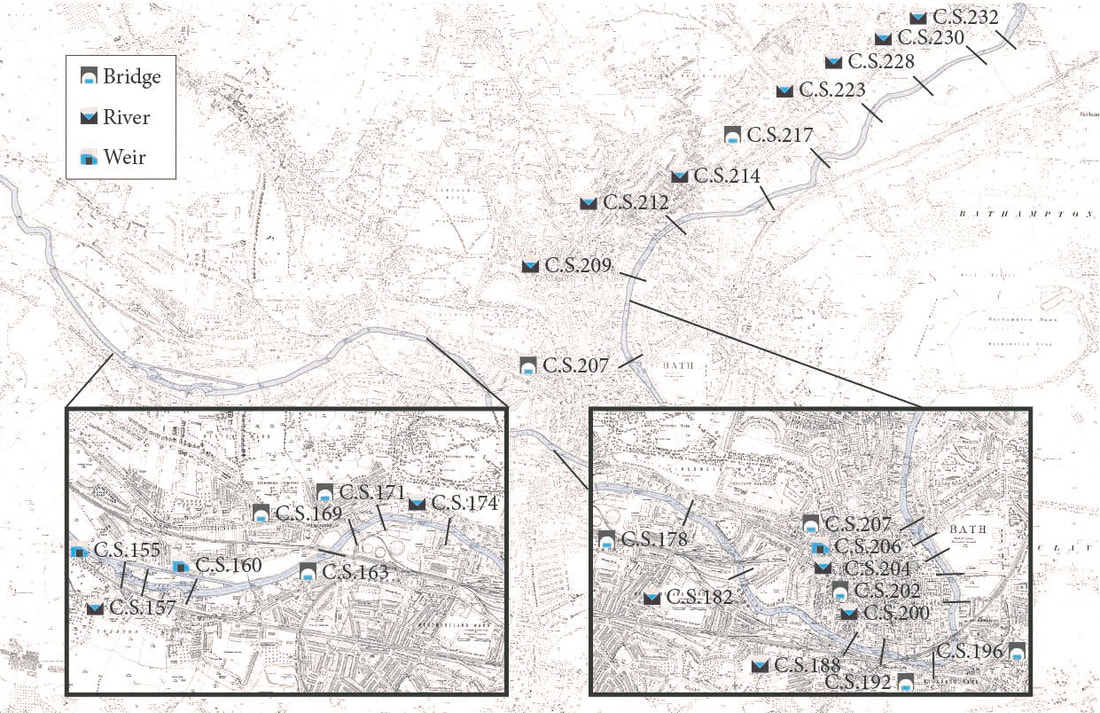 Figure: Map of the city of Bath highlighting the River Avon and the position of the river cross sections, bridges and weirs modelled in the hydraulic model Building a historical model is not an easy task and requires different aspects to be carefully considered. First, the river channel is separated into cross sections that represent the geometry of specific locations and are either simple river cross sections, bridges or weirs. The longitudinal distance between the cross sections also needs to be specified. The schematic below shows a simplified setup with an input hydrograph (the flow rate in the river over time) at the upstream end of the river, an initial river cross section, a bridge and another river cross section. 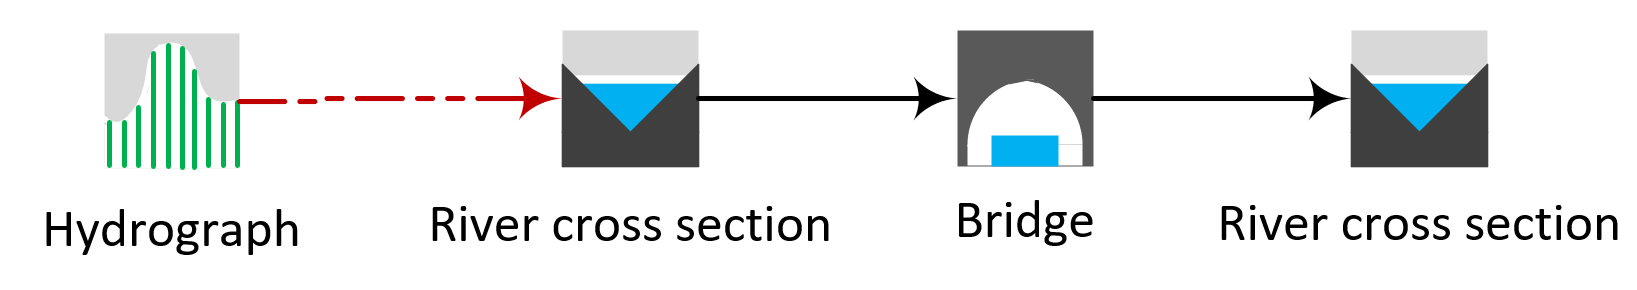 Figure: Schematic showing a simplified setup with an input hydrograph, an initial river cross section, a bridge and another river cross section. The first stage of the modelling process was therefore to create the numerical model for the River Avon and to achieve this we needed to obtain historical data of the river geometry and infrastructure at the time of the historical floods. The development of the model required river cross section data for the river Avon, historical maps, historical water levels and details of the bridges and weirs along the river’s path. We found on DIGIMAP a historic map showing details of the river geometry pre-Bath Flood Defence Scheme and decided that the study would create a model including approximately 8 kilometres of the River Avon from Bathampton Weir (cross section C.S.232) and down to the Twerton weir (C.S. 155) downstream of Bath city centre. The 54 river cross sections used for the historical model construction were found after extensive search in the Environment Agency’s Archives in the Bridgwater office among another 1112 scanned drawings relevant to the Bath Flood Protection Scheme. They were part of a longer survey of a total of 233 recorded locations which were measured in 1934 and replotted later to Newlyn Datums (the ordnance datum used as the basis for deriving altitudes on maps). An example of a cross section is shown below containing details of Old Bridge, which used to cross the river behind Bath’s train station until it was replaced with the current-day Churchill Bridge during Phase I of the Bath Flood Defence Scheme. 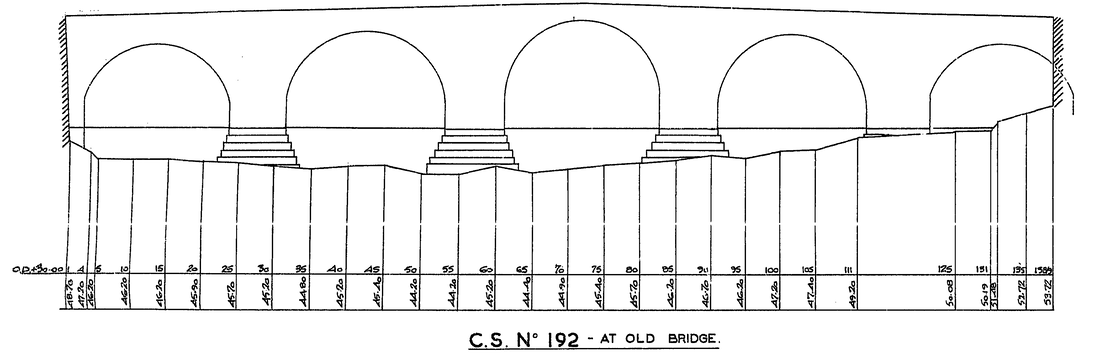 Figure: Cross section containing details of Old Bridge (replaced with current-day Churchill Bridge) To create a realistic flood model, we also needed reliable flood data and information. Flood hydrographs are graphs that show how a catchment responds to a rainfall event by plotting the flow rate over time for the duration of the flood. In numerical models, we introduce a hydrograph at the upstream boundary, in this case Bathampton, and let the water propagate through the river model. To start our model reconstruction, we were lucky enough to have found the water levels recorded during the 1960 flood on microfilm in the archives of the UK Centre of Ecology and Hydrology in Wallingford. The figure below shows the scanned hydrograph of the 1960 flood in Bath measured at St James’ Bridge which is located 3.3 km downstream from Bathampton and 200 metres upstream of the Pulteney Weir. 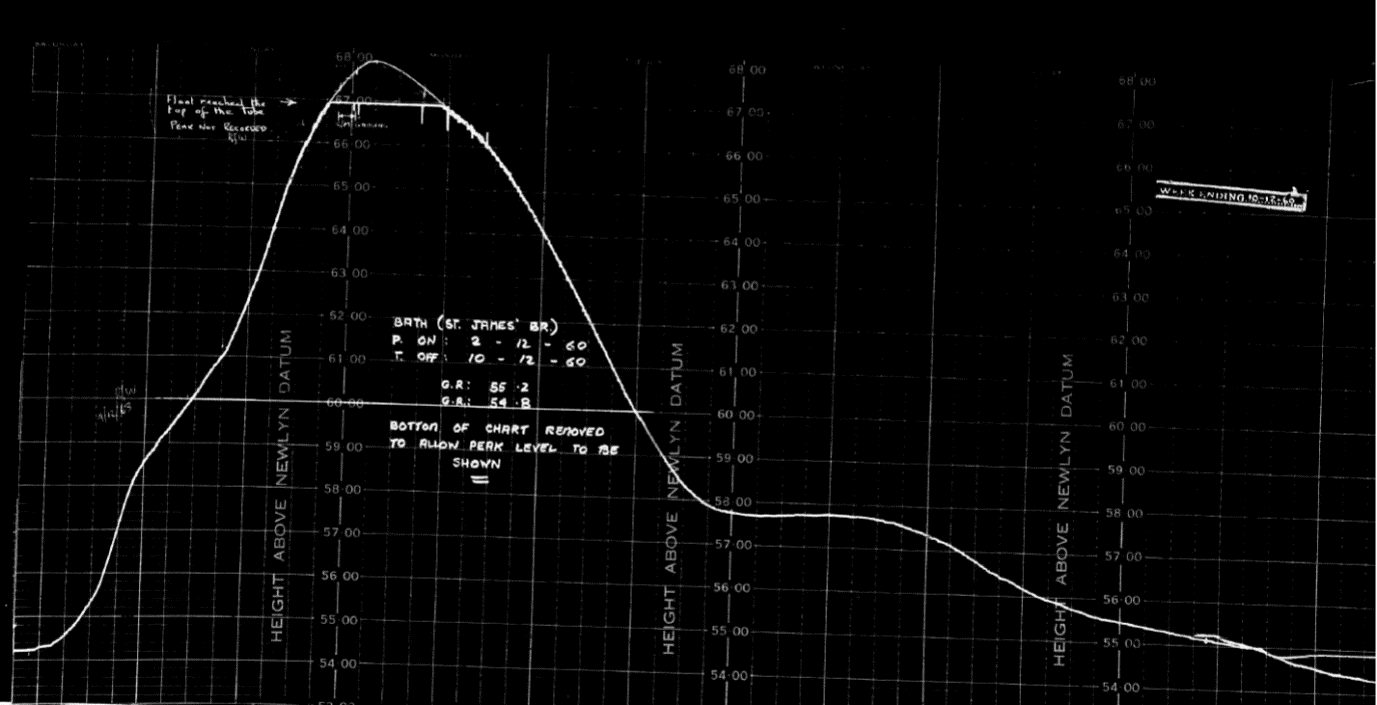 Figure: Scanned hydrograph of the 1960 flood in Bath measured at St James’ Bridge Using the software Flood Modeller a 1D model of the River Avon was constructed by combining the data representing the river geometry and the hydrology. The model provides an accurate representation of the river’s physical characteristics and hydraulic structures (bridges, weirs) between Bathampton and the Twerton weirs as it appeared before the implementation of the Bath Flood Defence Scheme. For the model construction, we started by digitising the 1960 hydrograph and all river cross sections. We started with the microfilm hydrograph for the 1960 flood which was manually scanned, digitised and translated from water depth to flow rate using a rating curve (a graph showing the relationship between flow rate and water depth at a given point of a river). Following that all cross sections were also digitised manually from the PDF files and the units were converted from “feet” to “meters”. Starting at the upstream end of the river in Bathampton, we started then to build the model. The digitised 1960 flood event was defined as the inflow hydrograph at the top of the numerical model. Next, the different river cross sections were added and the distance between them and the channel roughness specified. Finally, all hydraulic structures were implemented (bridges, weirs) using the geometric data from the cross sections. The slideshow below shows the inflow 1960 hydrograph, two river cross sections and the representation of Old Bridge in Flood Modeller. There are different outputs that can be extracted from the numerical model. Important and useful results in our research are the velocity, water depth or flow rate over time (hydrograph) at a specific location. It is also possible to visualise the results (as shown in the images below) and examine the water depth evolution at a specific cross section (in this case at Halfpenny Bridge) over time during the 1960 flood.
Figure: Visualisation of results at Halfpenny Bridge during the 1960 flood event The next stage of the research is to simulate some of the historical floods (e.g. 1960, 1894, 1882) and using the historical water marks at Halfpenny Bridge produce new modelled peak flows and compare them with the previously estimated flows. This stage will be described in the second part of this blog post so stay tuned in the next weeks. Acknowledgements
The authors are grateful to the Environment Agency staff in Bridgwater and the Centre of Ecology and Hydrology for their help and assistance. We would also like to show our gratitude to Jacobs for providing a Flood Modeller license allowing us to undertake this research.
21 Comments
|